
Map Service Publishing Based on QGIS Server
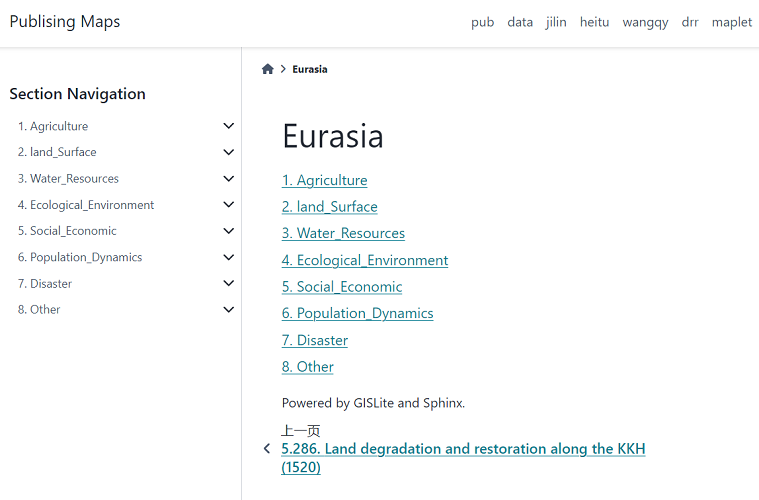
Use the static document website tool Sphinx to establish a map service publishing, and management tool to support the development of the project. For the convenience of management, a directory hierarchical self-derivation system is established using folder naming rules to form a secondary directory structure.
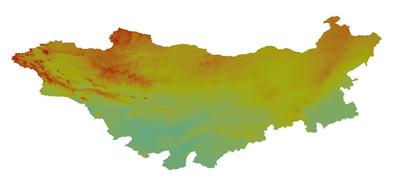
Mapping uses QGIS Desktop. Map services are published through QGIS Server. Obtain metadata content based on OGC related standards, including title, abstract, author, data source, date and time, etc.
The organization and construction of content use the Python documentation tool Sphinx. By adding the Leaflet plugin as a functional extension, this static website generator has the ability to visualize map displays.
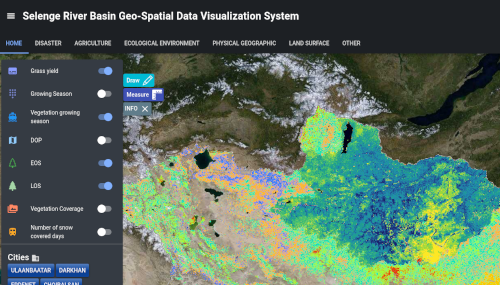
Selenge River Basin Geo-Spatial Data Visualization System
The Selenga River flows through the rivers of Mongolia and central eastern Russia, also known as the "Xueliangge River" or "Xuelingge River". Originating from the Hangai Mountains in Mongolia, it is formed by the confluence of the Ider River and the Mulun River. The river flows northeast and merges with the Erhun River at Sukhbaatar; The following is called the Selenge River, which continues northward and turns east into the territory of Russia, reaching the capital of Buryat, Ulan Ude. The river flows northward from here to Tatorovo, then turns westward and flows through a delta before flowing into Lake Baikal. The Selenge River flows gently downwards from Sukhbaatar to its mouth, serving as a passage for Mongolia to enter the Asian plain of Russia. The Trans Siberian Railway runs along the upper reaches of the river valley to Ulan Ude, where a branch line extends to Sukhbaatar and then up the Orhun River to reach Ulan Bator in Mongolia.
Online Research Collaboration System
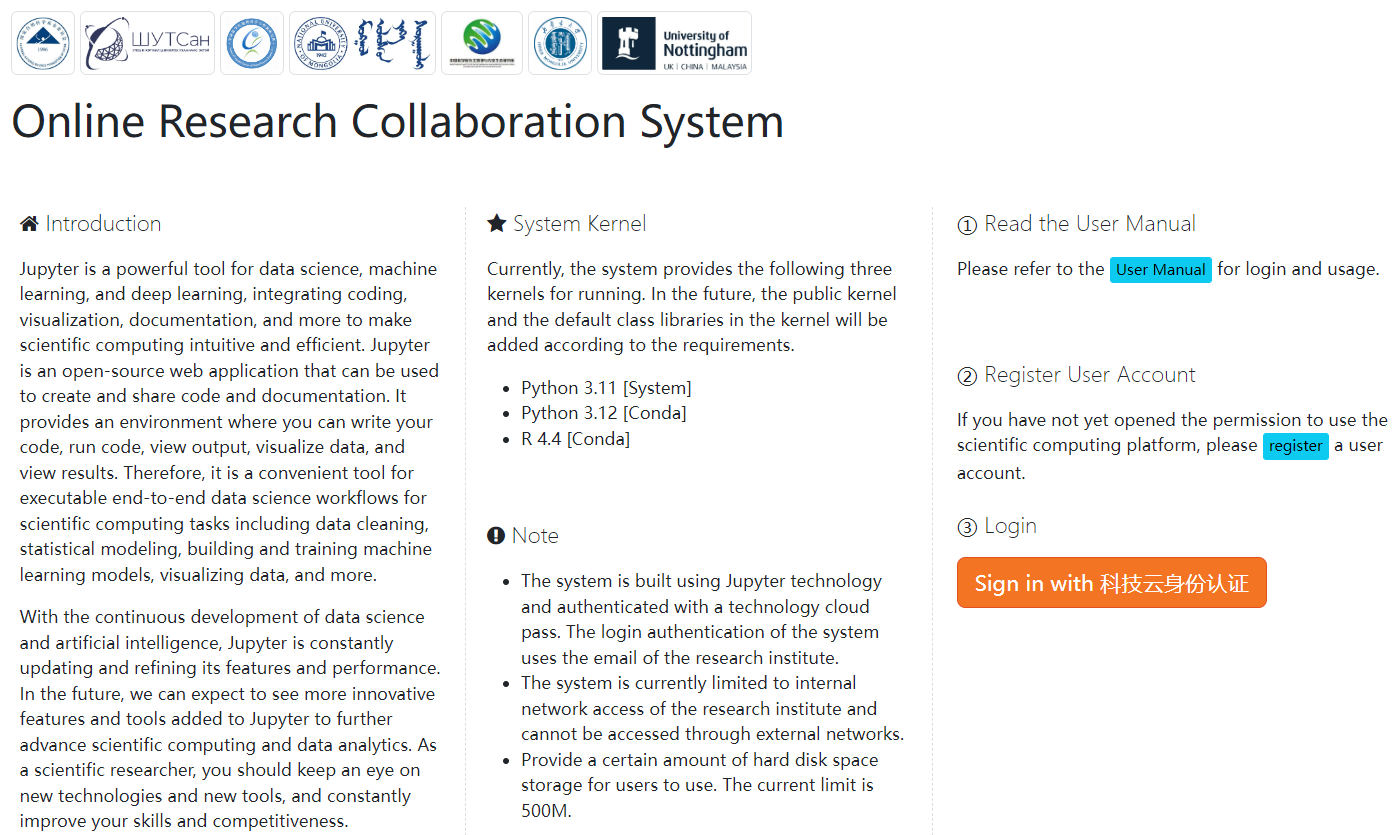
Jupyter Notebook is a web-based interactive computing environment that can be used for data cleaning and transformation, statistical modeling, data visualization, machine learning, and more. For users of data analysis, it is suitable for data visualization. By adjusting code and parameters to update charts and visualization effects in real time, interactive data analysis and visualization operations can be carried out, which can help us better conduct data analysis and exploration.
Benefiting from the Debian GIS/Ubuntu GIS project, there are currently many open-source GIS software tools available in Linux systems, and many tools can be called by Python.
This platform is based on Python, open-source GIS, and open data to build an online collaborative computing environment, establish visualization tools, and complete interactive collaborative data analysis.